coniun.io
Brief description for coniun.io - the NFT analytics platform.
Summary
What does it solve?
Coniun.io is an NFT analytics platform where you can discover new projects, see their potential by analyzing their holders and trading activities, see specific collection listings and trades in real-time, quickly buy the items you want without leaving coniun.io and lastly, get a deeper understanding for a specific collection with detailed charts. With Coniun.io, you can lower your risks while maximizing gains when trading NFTs with detailed analytics in this space.
How to get access?
You can get limited access to coniun.io for 1 Utility Gem or full access for 2 Utility Gems. Learn more about the difference between limited access & full access.
You'll need to pay $8/month besides the Utility Gems you've spent to get access.
Where to get access?
You’ll be able to see stake/yield options on Staking tab on Coni's official website.
You’ll be able to see your current Tier if you have staked any $CONI.
You’ll be able to see your total and available Utility Gem(s) count based on your stake if you have any.
You’ll be able to see available utilities which you can get and the required Utility Gem(s) for each utility.
You’ll be able to get the utility you want by clicking Unlock if you have enough Utility Gem(s) to spend.
You’ll be able to give up using a specific utility and get back your Utility Gem(s) you already spend for that, then you’ll be able to use these Gem(s) again to get a new utility.
-----------------------
Here is a wrap-up of all features of coniun.io:
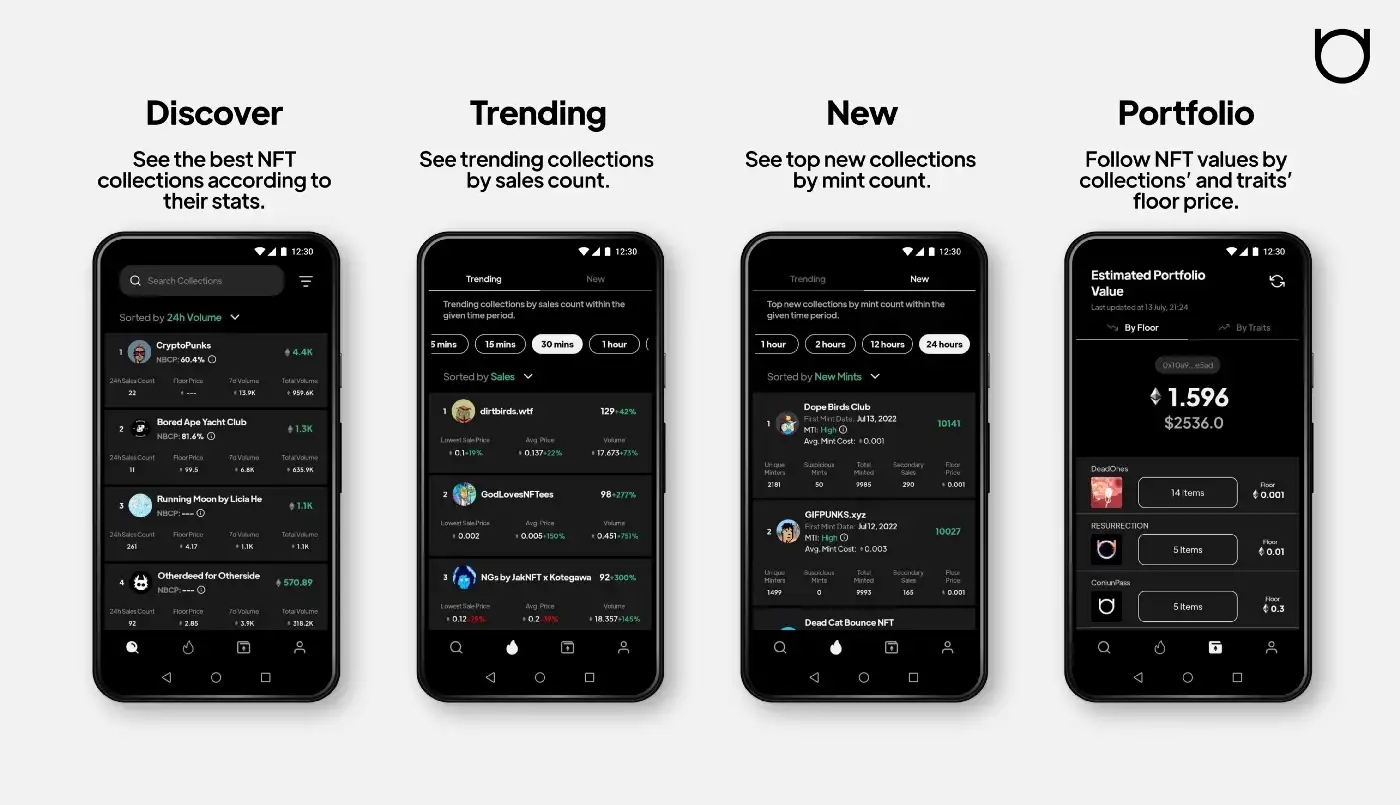
1. Discover
This is the place where you can discover the NFT collections by their stats like total sales, 24 sales, 24h volume, floor price, and total volume. You can filter the collections by adding custom values and getting detailed data about them.
1.1. Collection Detail
1.1.1 Dashboard
Here, you can get detailed insights for discovering sales & listing activities of a specific collection here with Sales History, Seller Report, Listing Distribution, Candlestick Price Chart, and Holders Distribution charts. Each of these charts allows you to click on details and zoom in/out to dive deep into more details.
Real-Time Listings/Sales & Rarity Rankings is available here to provide you the data about the current transaction activities of that project for your consideration of buying/selling it. You can also fulfill the open orders from OpenSea via Coniun's Dashboard without leaving coniun.io, and set your fast buy specifications by entering your Max Priority Fee (GWEI).
1.1.2 Holders Report
You can see the amount of the items owned in that collection, the percentage of supply, and wallet address with their Twitter profiles, and you can follow them in View Holders Report. You can also see the top owners of a specific collection with their followers.
1.1.3 Holders Activity
If you are curious about the activity of the holders of a specific collections within a collection you want to see, including all alpha groups or whale projects in the NFT space, you can see Transaction Count, Items Sold, Items Bought, and Items Minted in Holders Activity. This will let you understand which collections’ holders are really interested in a specific collection and how many transactions they already made.
1.1.4 Compare Holders
If you are planning to hold an item from a specific collection, you can see other holders in Compare Holders and consider your upcoming steps for your investment by viewing the mutual holders of two collections and how many items they own.
1.1.5 Next Blue Chip? In Next Blue Chip, you can see how many blue chip holders owned items from this collection with the count of mutual holders. This feature is based on the NBCP (Next Blue Chip Probability) metric Coniun invented (and was copied by other projects after Coniun released it). This section gives you a clearer understanding of the hype of a specific project and also if it is a profitable investment or not. You can also consider this metric as a credibility indicator in this respect.
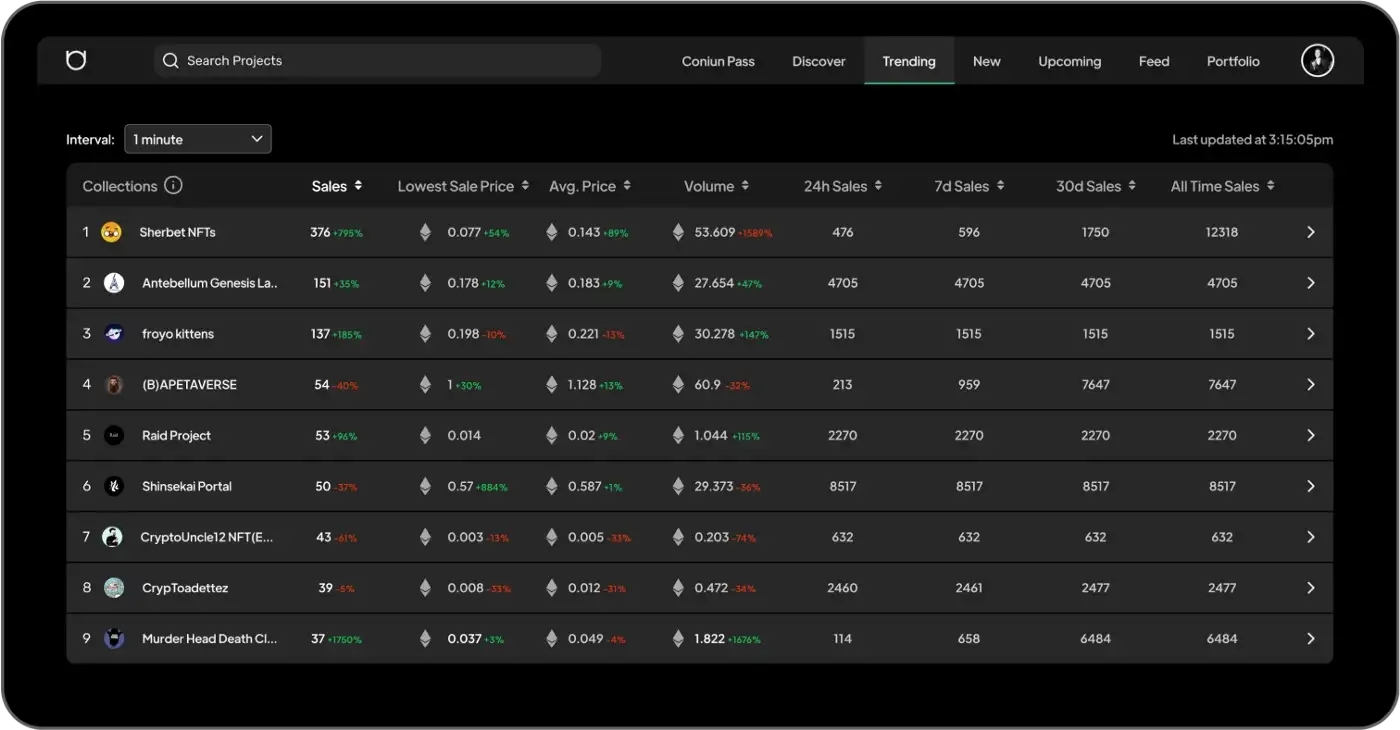
2. Trending
Here, you can see which collections are trending by their sales count in a given time interval and their comparison to the previous one. When you choose a specific interval to filter the data, you will see the count of Sales, Lowest Sale Price, Average Price, and Volume compared to the previous period.
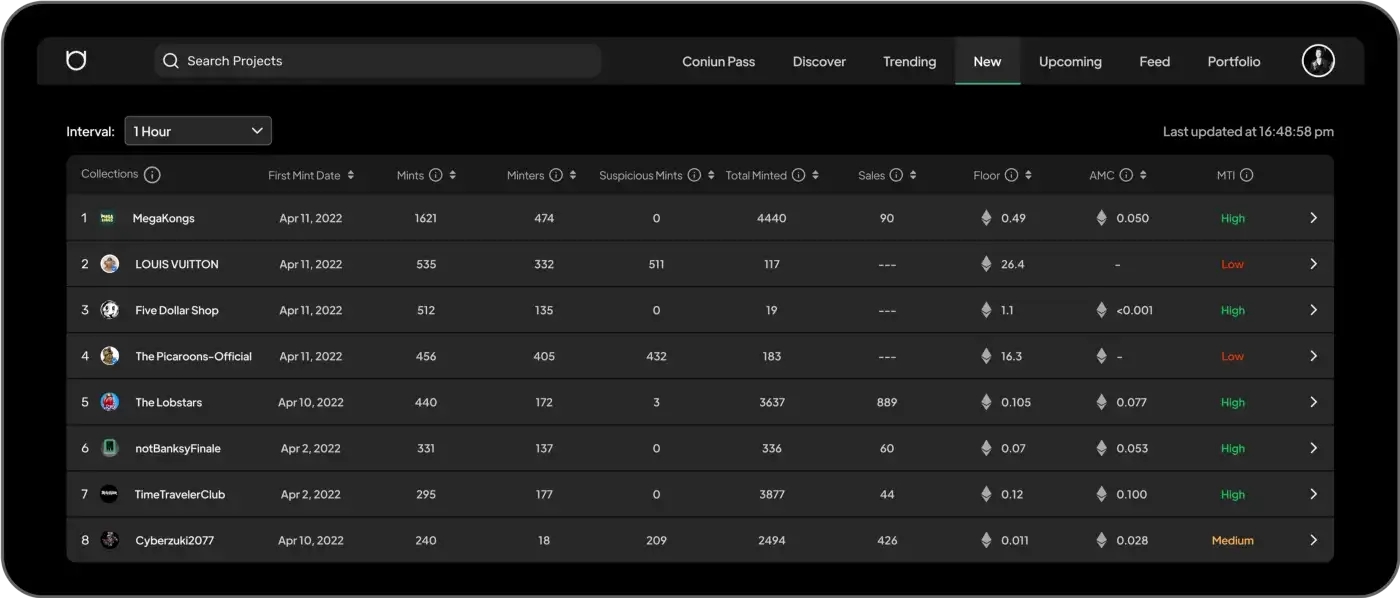
3. New
You can filter the data and see the top mints by choosing different time intervals from 1 minute to 24 hours of activity, including First Mint Date, number of Unique Minters, Suspicious Mints, number of Total Minted items, Total Sales, and current Floor Price. Here, there are two metrics that Coniun invented. MTI (Mint Trust Index) and AMC (Average price of all mints Coniun detected). If the ratio of a suspicious mint count/total mint count is high, its MTI will be low, and that means you should think twice about minting it.
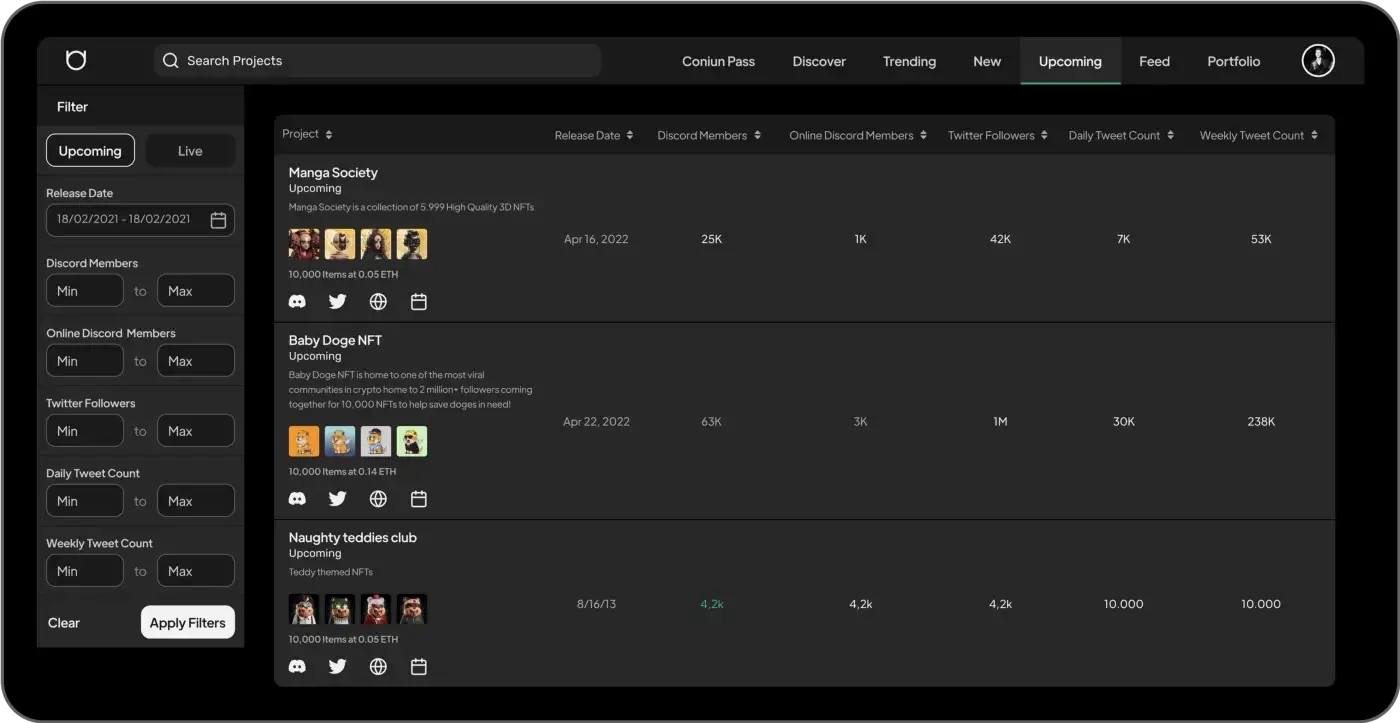
4. Upcoming
This feature functioning as an actual time-saver for your upcoming NFT projects research. You can filter projects as upcoming or live by choosing a release date. If you want to sort them with a more custom approach, you can also add custom values and filter according to their volume of Discord members, Twitter followers, and weekly & daily mentioned tweets about them. You can consider it a hub for all shortcuts and a way to estimate the real hype or demand for an upcoming project at a glance.
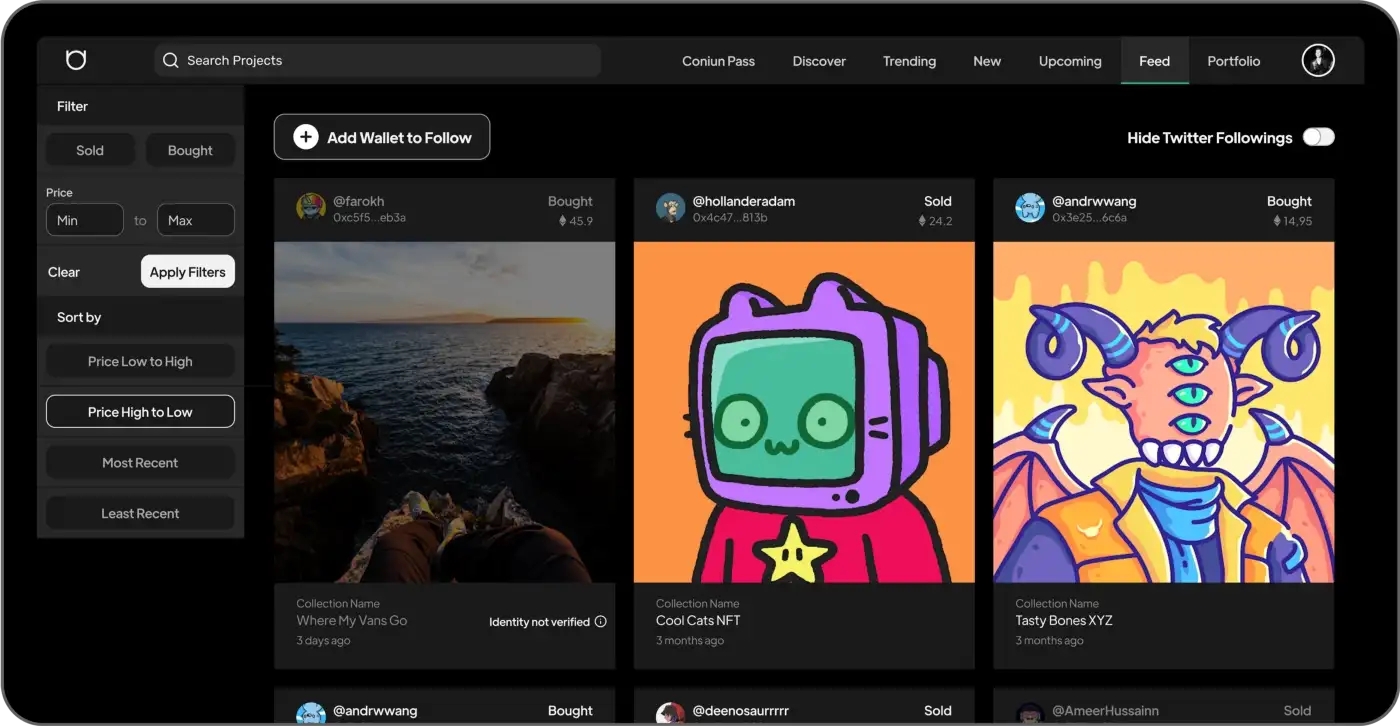
5. Feed
With this feature, you can see the activity feed of the people you follow on Twitter. You can filter the data by choosing sold or bought collections according to their current prices. You can also sort all collections according to Price Low to High or Price High to Low, Most Recent, and Least Recent. You can add wallets here to follow, and if these collections are connected to a Twitter account, you can hide or see the results by Twitter followings.
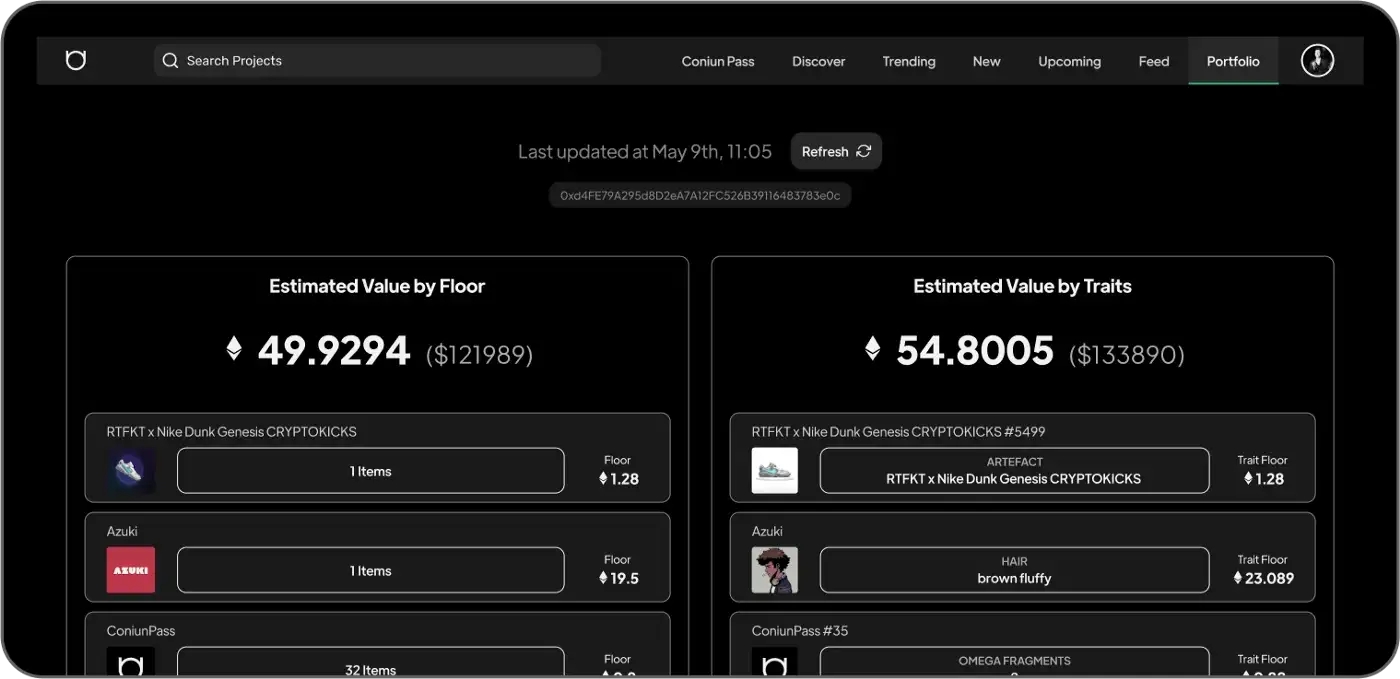
6. Portfolio
You can calculate your portfolio’s value by floor price and traits. The Portfolio feature ensures you are aware of that in which sense you have made profitable transactions so far. You can consider this a chance to review your wallet within the market and combine the data on our other features for deciding your next moves.
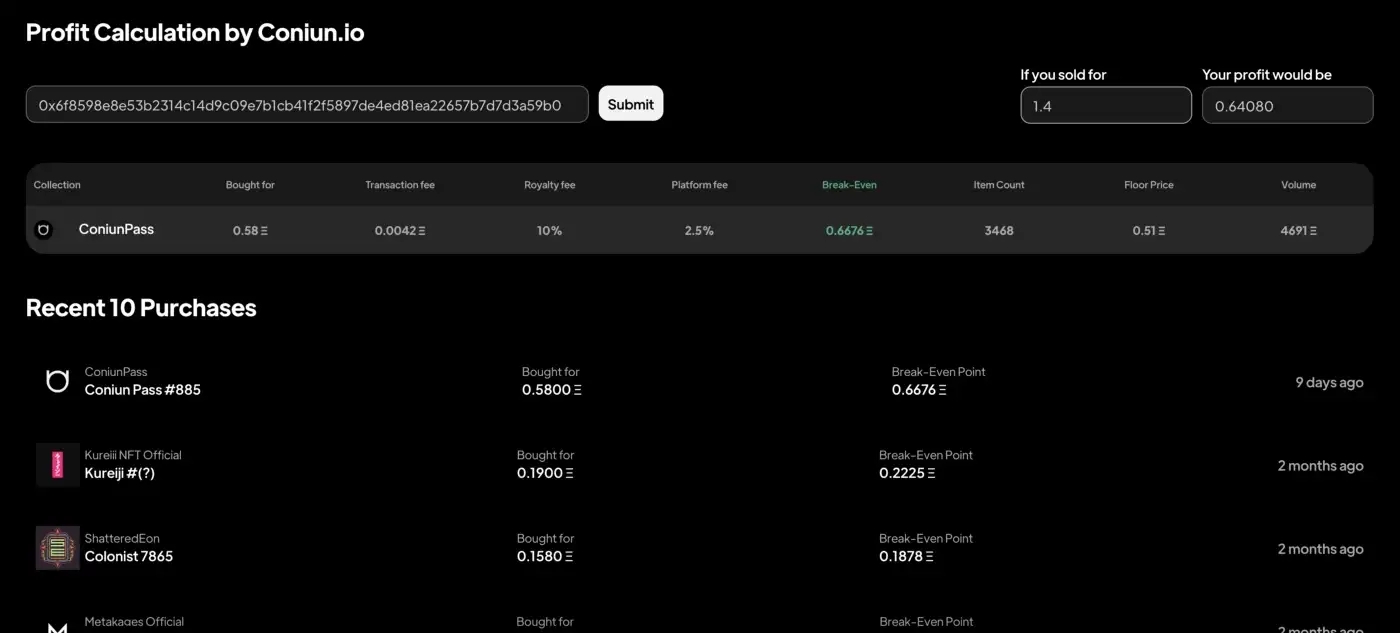
7. Profit Calculation
You can enter the transaction hash manually or select one of your recent 10 purchases to calculate your profit and break-even point. You can use it even if you are not a Coniun Pass holder.
8. Mobile Apps (iOS & Android)
Coniun.io is also available on App Store & Google Play. The Android app version is a bit more detailed than the iOS app due to Apple’s strict limitations for NFT-affiliated apps.
Last updated